Monitoring my Java application using JMX MBeans
August 9, 2014 . Comments
Tags: java, JMX, Monitoring, JVM
I want to get metrics out of my code. In olden days the best way to do that is by using System.out.println. I want to use the below code and see how fast it takes to run serialization and deserialization along with gzip compression.
The above code is messy in lot of ways and particularly not reliable in collecting the metrics. Also this code does not give metrics for each run will get quite a few PMD violations. How do i get rid of all these issues and collect proper metrics for how well my serialization code performs.
The best way to do that is by using JMX MBeans which would expose all the needed metrics to JConsole.
We define our MBean interface that holds all the attributes to be exposed to JConsole
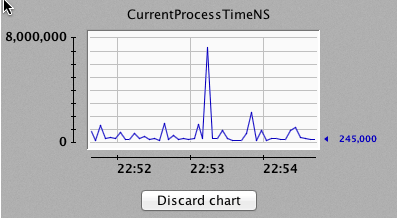
In the above all long getter that do not have a matching setters will show a neat graph like below when you double click.
Now for the actual implementation of the counter.
The code above is pretty straight forward. All it has is to do with holding values for the time it takes to process single request and a counter to see the number of requests processed. The other information like total average are all calculated. Now we need to expose this counter for each public method which we want to assess for performance.
I would introduce an enum for exposing the counter for each method like below.
All the counters for the methods defined in the enum are preregistered with objectName and set to be used. The object name MBean can be monitored in JConsole or JVisualVM using the fully qualified class / method name.
Now in order to have the counters set with proper value we include it as part of the product code like the sample given below
The key part from the above code that enables monitering is
TimeLapseCounters.serialize.getCounter().setCurrentProcessTimeNS(time);
Now I can increase the number of threads in my thread pool and have the counters collect the metrics and we can monitor it from JConsole/JVisualVM.
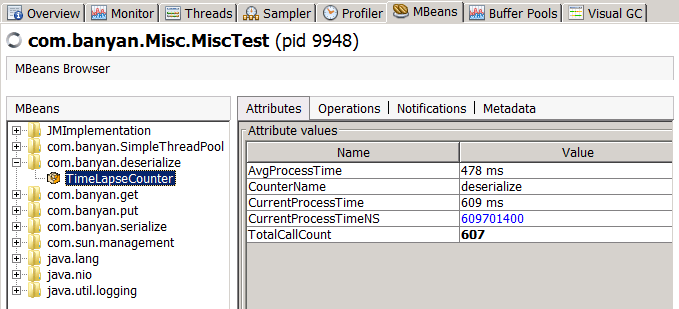
Now we can see all the counters exposed by the MBeans. I can monitor the performance of the method. I can clearly see that the code is spending too much time in deserializing even though the bytes to read has reduced significantly. The time taken for deserialization does not help when it comes to performance.
You can find more blogs later that talks about serialization metrics, compression metrics and notification.
Feel free to comment on the post but keep it clean and on topic.