JVM options for performance and GC
August 8, 2014 . Comments
Tags: java, GarbageCollection, JVM
In this blog i will be talking about some of the JVM options that we can use for tuning performance and doing memory management.
When we want to set the memory ceiling for my java code i use the -Xms4m -Xmx4m option. This says that the minimum and maximum memory used for my app is 4 MB.
Code for SimpleThreadPool can be found here.
I wrote this code to see the behavior of GC with different options. With just this option -Xms4m -Xmx4m the memory foot print becomes like the below
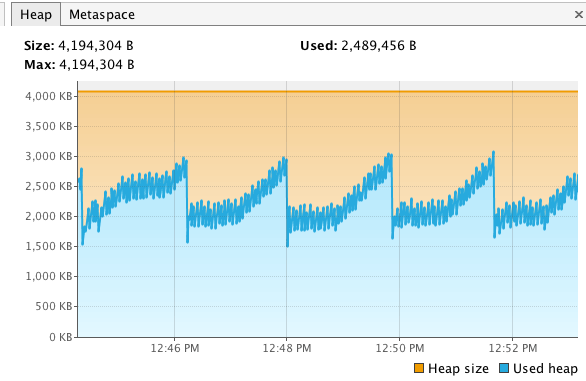
with the option -XX:+UseConcMarkSweepGC option the image becomes like

The difference is mostly like asking the kids to cleanup the mess at the end of the day vs immediately when they make it. The later is better while writing enterprise level applications to avoid stop the world garbage collectors. It is also preferable to write code that gives less garbage wherever it is possible topic for another time.
The effect on CPU and garbage without -XX:+UseConcMarkSweepGC is given below when we tweak the variable MEMORY_MIN_THRESHOLD=100; instead of 3 and set the vm option to -Xms4000m -Xmx4000m. Now I made the GC kicking and and spend more time in this case more than 37% of the CPU
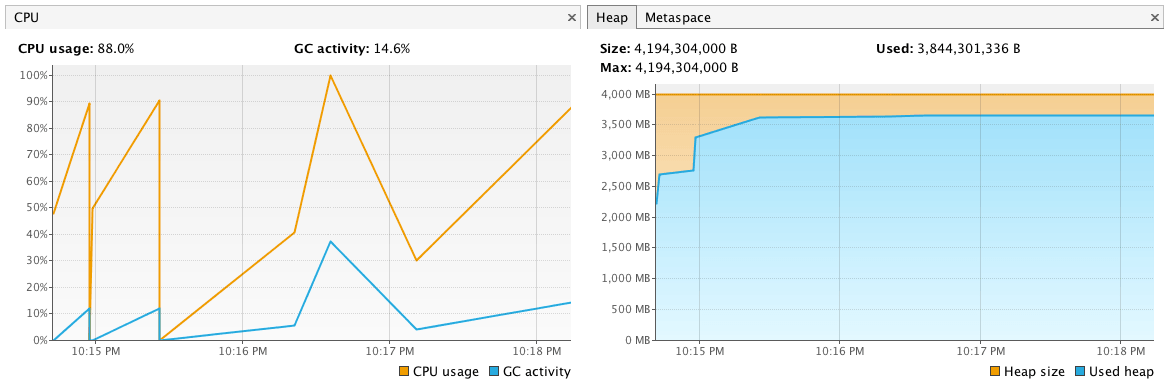
The high CPU is due to the locks caused by LinkedBlockingQueue trying to run the threads in a tight loop apart from the GC trying to free up memory. Don't do this in your code. and oh my god more than 90% CPU and the system is choking hard what do I do?.
I tried -XX:+UseConcMarkSweepGC -XX:ConcGCThreads=4 and ran the application again i got the below result
This is slightly better than the above but still bad due to the CPU spikes. The time on GC is less than 10% of CPU which is better than the previous result.
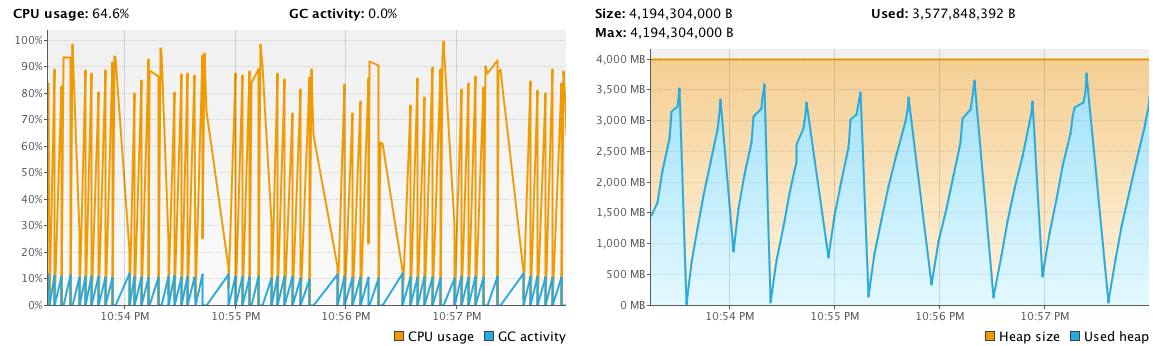
So i tried experimenting with -XX:+UseParallelGC -XX:MaxGCPauseMillis=1 -XX:ParallelGCThreads=4

The GC is happening more frequently and the CPU spent on GC is less than 10% and total CPU spike is less than 50 % much better picture.
While write an application , releasing memory whenever done is a good practice and allocating them incrementally as need basis -XX:+UseConcMarkSweepGC option will be our friend still may need to play around with -XX:ConcGCThreads=4 based on need and number of threads used.
If we are hogging up memory and releasing them like in the code above when the memory is almost full we have the option to use -XX:+UseParallelGC -XX:MaxGCPauseMillis=1 -XX:ParallelGCThreads=4.
There are other JVM options to tune like -XX:ThreadStackSize which can be tuned if we are writing a lot of recursive operations in our code. The full list of JVM options can be found here. There are other options to fine tune the young and old generation memory space.
If we are writing code that requires more memory than the system actually has. It is always possible to allocate more during startup with the option -Xms53000m -Xmx53000m. I had tried to allocate close to 53GB on my MAC. It tries to allocate as much as possible and for the rest the OS does page faults and loads the items into memory opportunistically which would hinder performance. This helps in testing my long running code from home on my laptop.
As a general rule of thumb i tend to allocate 60% of the server memory for my server side code JVM and use 70%-80% of the memory that is allotted to the JVM to avoid things like stop the world GC.
There are other programming practices which can be done to avoid garbage and improve performance which we will cover separately.
The code sample given above is for learning the behavior of JVM only and should not be used as a defacto coding standard.
Feel free to comment on the post but keep it clean and on topic.